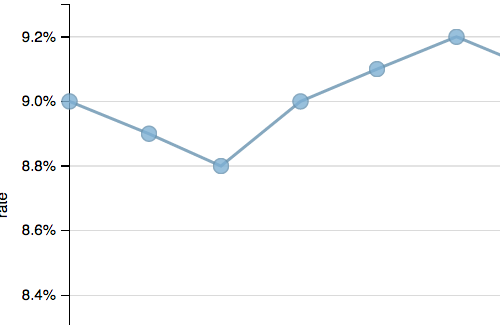
U.S. unemployment rate
Learning D3.js
This chart is an implementing of the task from Udacity Data Visualization and D3.js course. For this exercise, we learned that is charts are great just when you use the actual data. I've used D3 library to plot a line graph of the dataset.