
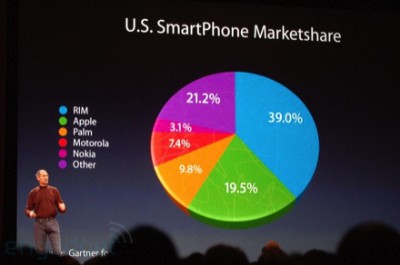
U.S. Smartphone Market
Learning D3.js
It is a bar chart made as an exercise in the Data Visualization and D3.js course. I redesigned a (bad) pie chart that was presented in one of the Steve Jobs presentations about the smartphone market. This exercise also persuaded me to not use pie charts anymore =)